Dashboards built onnumbers that reconcile.
We build reporting your finance and operations teams can trace back to source, in the BI tool you already use.

01Who it is for
The problems we are usually called about.
Finance, operations and leadership teams who want one set of numbers, and analysts tired of maintaining dozens of overlapping reports.
Dashboards that disagree
Two reports show different revenue, and both authors can defend theirs.
Hundreds of reports, few used
Nobody knows which are current, so new ones keep being built.
Numbers that do not tie to the ledger
Finance spends the first days of each month explaining the difference.
Slow, fragile reports
Dashboards take minutes to load and break when a source changes.
02What we do
One definition of each number.
Metric definitions
Revenue, margin and headcount defined once and used everywhere.
Dashboard builds
Designed around the decisions people make, not around the data available.
Tool migrations
Reports moved between BI tools without losing logic.
Self-serve enablement
Your analysts trained to build on the same foundations.
03How it runs
Step by step.
- 01
Scoping call
We learn which decisions the reporting should support and where trust has broken down.
- 02
Define the metrics
Each key number is defined once, agreed with its owner and written down.
- 03
Build the model
A shared data model sits beneath every report, so definitions cannot drift.
- 04
Build the dashboards
Reports are designed around decisions and tested against source figures.
- 05
Retire and train
Old reports are switched off and your analysts are trained to build on the new foundation.
04What you get
Delivered, documented, yours.
Reports that agree with each other
And with the ledger.
Fewer, better dashboards
Old and duplicate reports retired.
A documented model
So new reports start from the right definitions.
Tools we work with
Your stack, not ours
From our work
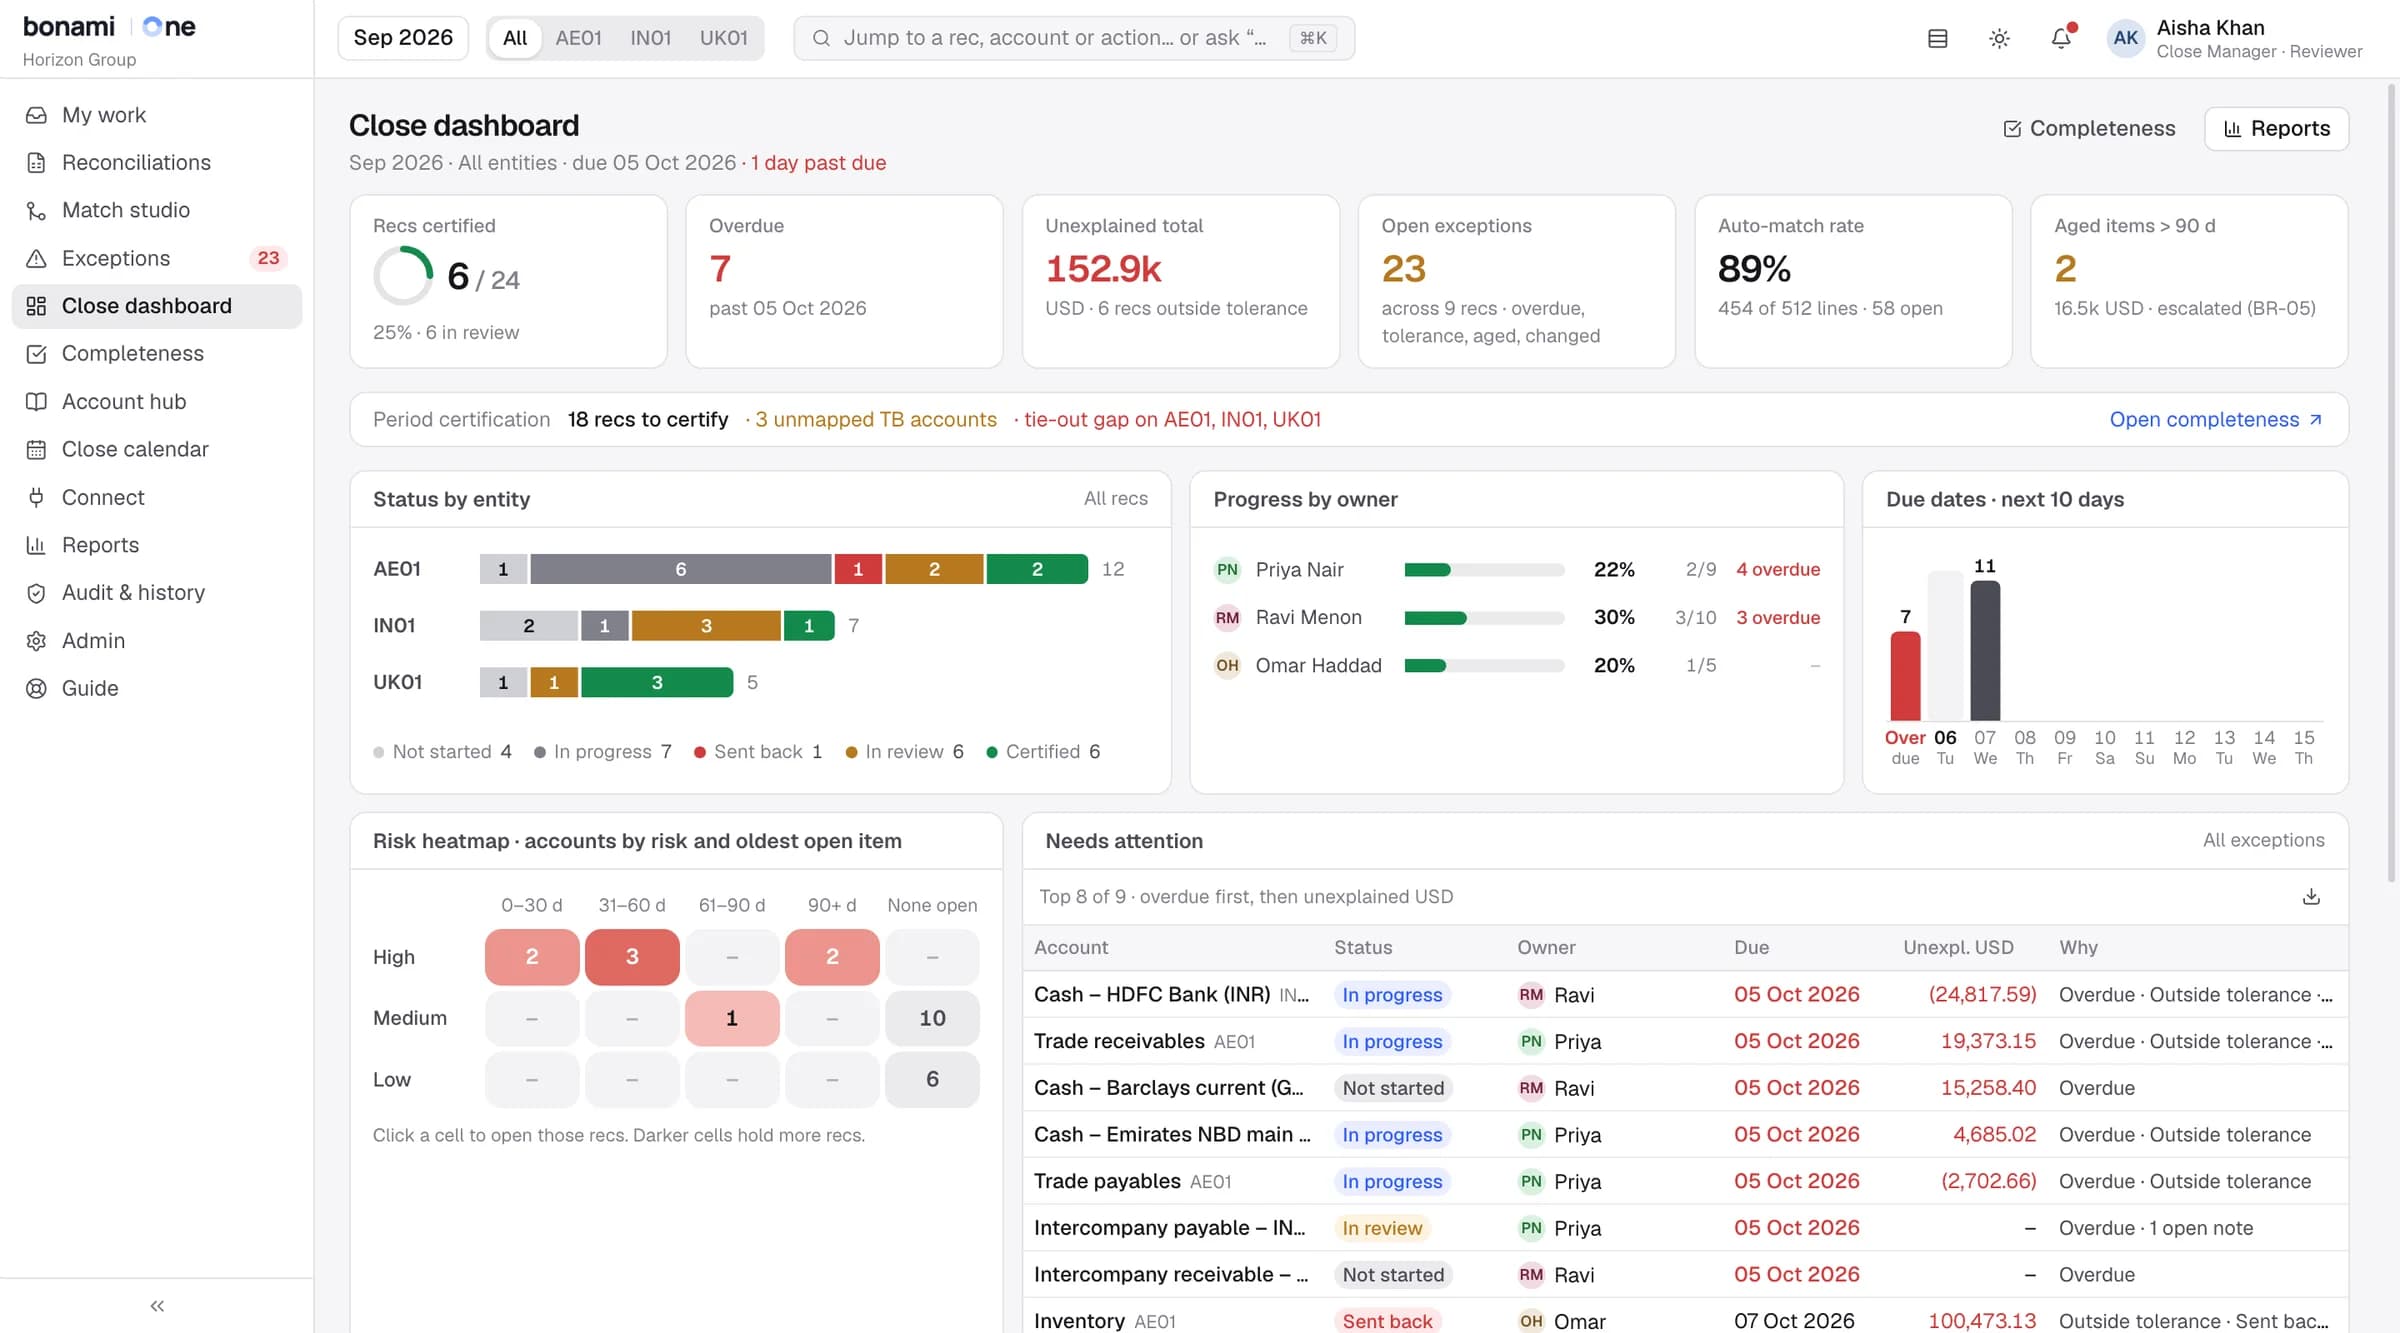
Account reconciliation platform
A month-end reconciliation platform for a finance team moving off spreadsheets. AI proposes the transaction matches; people review and sign off.
Questions
What clients ask first.
Do we need a new BI tool?
Usually not. Most reporting problems come from the data and definitions underneath, not from the tool.
How do you make numbers agree?
By defining each metric once in a shared model, and testing every report against the source system before it is released.
Can business users build their own reports?
Yes. Once the model is sound, self-service is safe, because everyone starts from the same definitions.
What happens to our old reports?
We review usage, migrate the ones that matter and retire the rest by agreement.
Can you move us from one BI tool to another?
Yes. We move the logic as well as the visuals, and check the results match.
Do you use AI to build our reports?
Our engineers use Claude Code inside your environment to write and test the data model faster. Every change is reviewed by a person, and every figure is checked against the source system before a report is released.
Tell us what you run.
Thirty minutes with an engineer. You leave with a clear scope, a timeline and a recommended approach.